Terms
Calibration is in the field of measurement of water parameters for the definition “Which signal of the sensor corresponds to which value.” used.
Sensors mainly emit an electrical signal proportional to the concentration of the measured variable. This signal can be defined by the manufacturer or a standard signal.
In electrochemical processes local factors are effectually. These influences can distort the results. Therefore, this distortion must be checked and balanced. The meter or transmitter is notified when calibrating, which size of the signal is to agree with which value to be displayed. The settings are made on the meter.
The sensor or its signal will be not changed.
Signals
Electrical signals can be transmitted in several ways:
- as a pulse,
- as a digitally encoded signal within a specified protocol,
- as voltage and
- as a current.
Pulses are used, to describe one-time actions or transmit an almost analog value via the frequency. One example is the pulse to a solenoid pump.
Some sensors can already transmit signals and values via Modbus. The meter has to understand the language of the bus protocol.
A standard signal is 0 … 10V. Programmable logic controllers (PLC) provide interfaces for this signal to.
Membrane-covered amperometric sensors use the 0 … -2000mV signals to transmit values with a high-resolution.
For the transmission by current is the 4 … 20mA signal used. Across from 0 … 20mA is the advantage, that disconnections can be detected.
high-impedance measurement
ORP- and pH sensors require no auxiliary power. The input of the transmitter must a high resistance, usually more than 1015 Ohm, have.
Direct interpretation
ORP-Sensoren: the famous exception
Redox electrodes build a voltage on by the hydrogen. The range of these voltage is from -1500 to +1500 millivolt. The voltage enables a statement whether the water is oxidizing or reducing.
A proportional relationship to the concentration of a substance can not be derived therefrom. Therefore, the measure of this voltage is the direct parameter. He will not be translated into another value. The voltage is directly displayed. Therefore, a factor in the transmitter is not necessary.
The sensor is only checked. For this purpose, it is immersed in a liquid having a known and fixed voltage and both voltages compared. These liquids there are, for example, + 220mV or + 468mV.
ORP sensors require a high impedance input on the meter.
Two-point calibration
on the example of the pH sensor
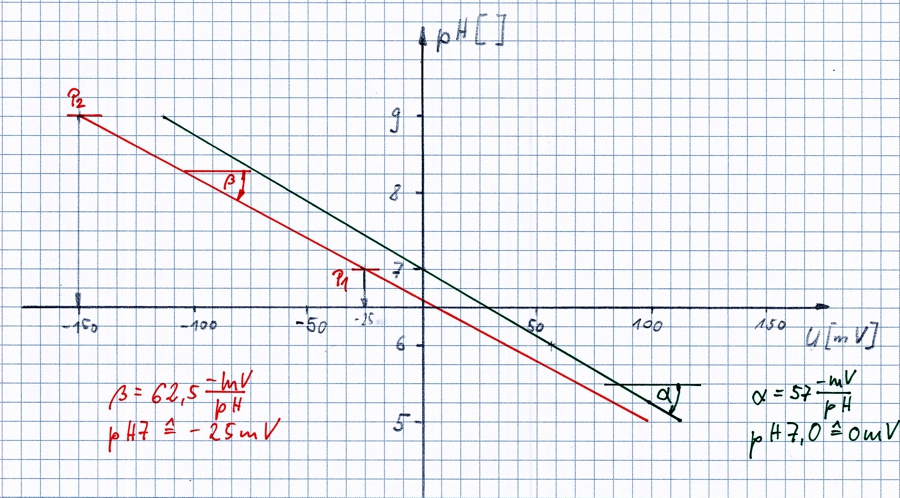
The pH electrodes are usually produced so, that is generated a voltage of 0 mV at pH 7.0. In the new state, the voltage depending on one pH level is changed by -57mV.
In the sketch of this state is shown as a black straight line with the angle α. It is located in the points (pH7 / 0mV) and (pH9 / -114mV).
Local conditions and the special characteristics of this electrode have changed the state of the red line.
For calibration requires two liquids with a fixed pH value. mostly 7,0 and 9,0. The clean electrode is then dipped into the liquid at pH7. The meter is said, the voltage which is now shown corresponds to the value pH7 from now. A new point P1 calculated. See sketch. The same procedure follows for pH9 and P2.
The transmitter knows from now two points on the line and can calculate from the corresponding pH for each voltage and show.
Of course, the transmitter must have matching routines for pH values. During calibration, the rinsing and drying of the electrode is necessary. Depending on the pH and the temperature of the liquids used change.
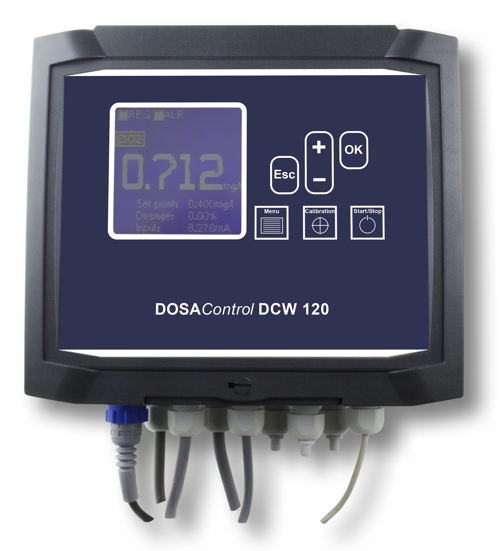
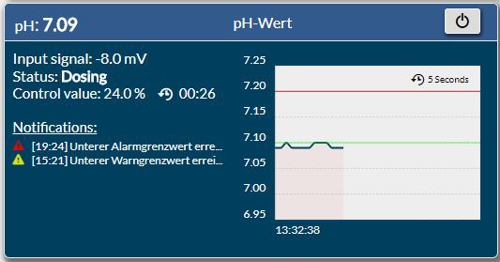
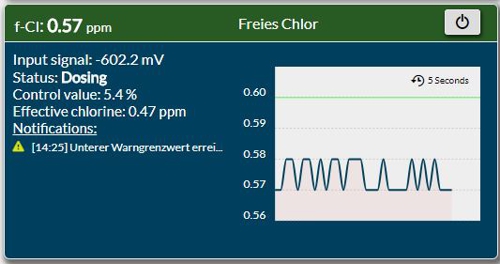
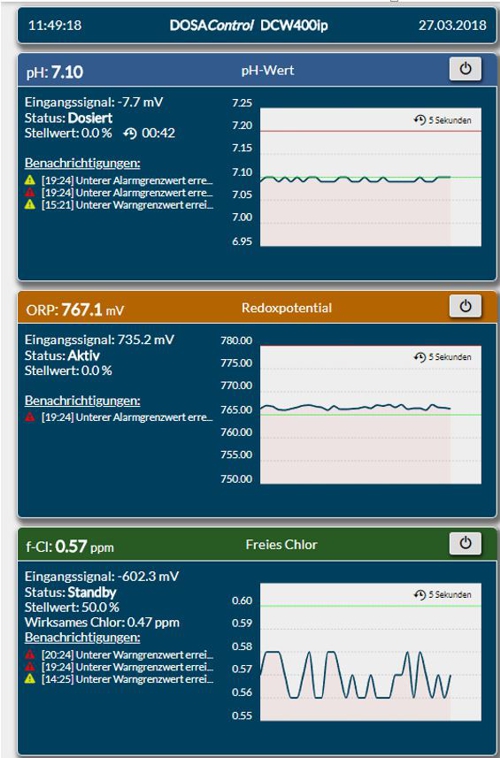
In the- controller DCW400ip the pH and the sensor signal in millivolts is displayed.
Reference measurement
is the prerequisite for a successful calibration
The reference measurement is then necessary, when preproduced liquids produced are not suitable. This can be, because the liquid can not be stored, or because the transport is not allowed. You have to use a liquid on site and measure it for comparison.
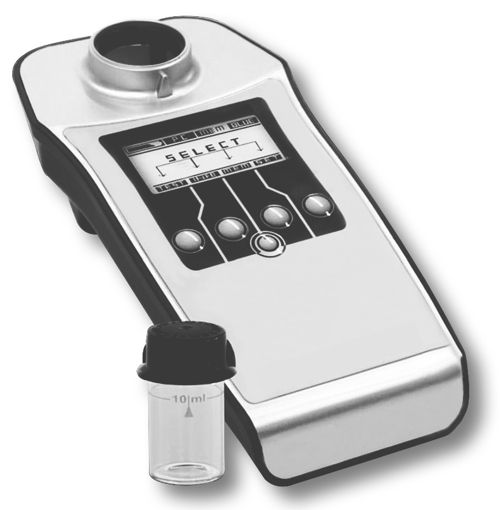
As an example, the measurement of free chlorine is used. The usual method of measurement is the DPD Messsung usomg a photometer. Photometer, a measuring range is called dependent on the manufacturer of the equipment and chemicals . The measuring range starts at about 0.05 mg/l and ends in the example at 5.0 mg/l. In some cases, a resolution is given, but which is a technical parameter.
The biggest mistake is, to put this resolution to the accuracy of measurement equal. The precision is defined by the user.
This can and should be checked. A user should be a row 10 times completely measured in the same sample of about 1.0 mg / l. What is the average and how big is the deviation. Presumably ± 0.1 … ± 0.2 mg/l be achieved. This is the accuracy of measurement! This accuracy is independent of, whether in 10,00 or 5,00 or 1,00 or 0.5 mg/l, was carried out.
The same test should be performed with a second user. How large the second average from the first average? The spacing of the averages representing the individual error of the users.
A real example of Peter and George had the result:
- Peter average was 0,92mg/l, upper deviation was 0.10 mg/l, lower deviation -0,11mg/l,
- Georg: average 1,06mg/l, upper deviation 0.15 mg/l, lower deviation 0,09mg/l
Especially with very small setpoints for the concentration, this relationship must be taken into account as error consideration in the one-point calibration.
The relationship between free chlorine, the pH-value and the DPD measurement is an issue in the tutorial to chlorine.
Conditions for One-point calibration
must first be ensured.
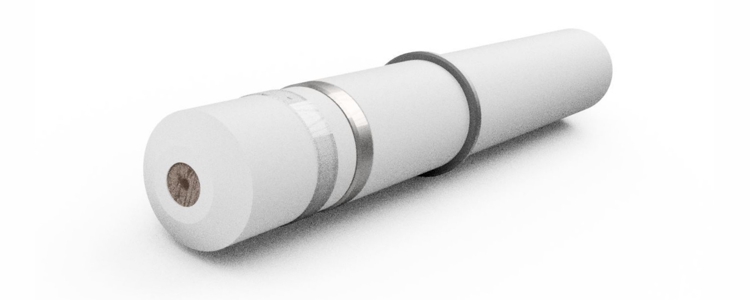
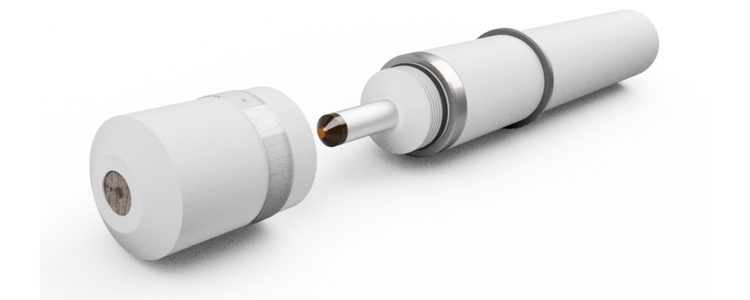
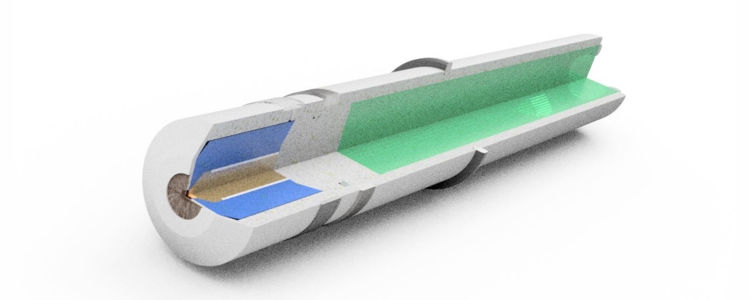
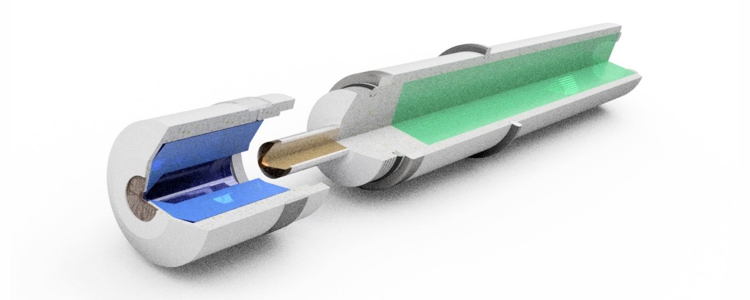
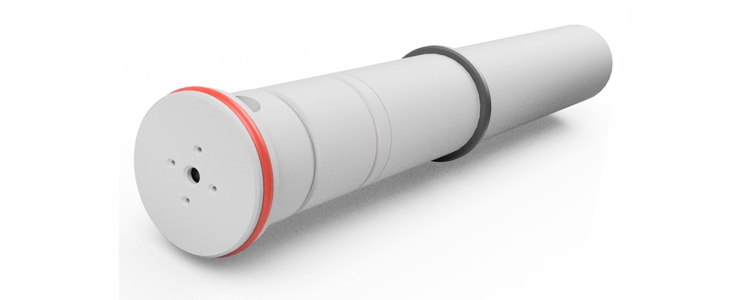
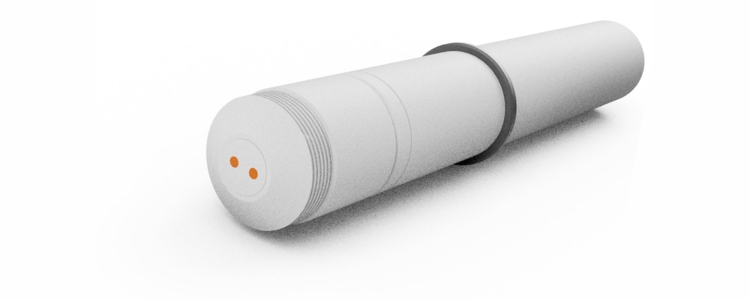
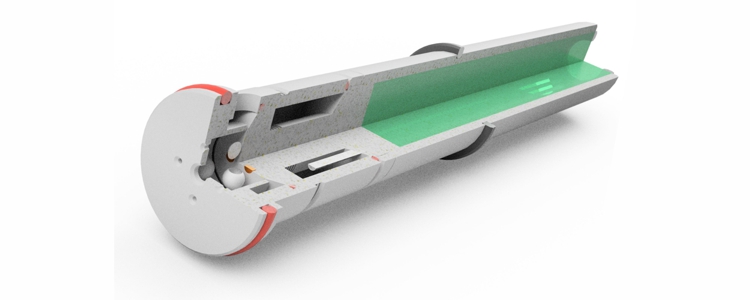
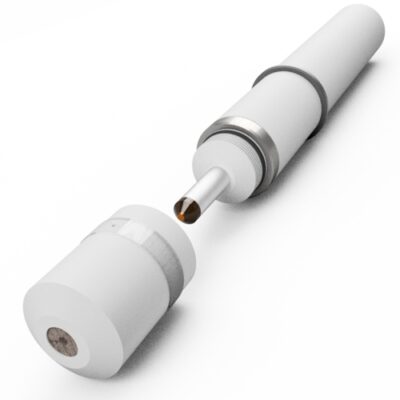
For this example, the measurement of free chlorine with a membrane-covered sensor of the brand DOSASens is used.
The name “1-Point calibration” is wrong! Even this method uses 2 Points. But as one point always sitting in the origin of the diagram, is discussed only the other point.
Thus the first important piece of information is given:
- The calibration point may not be at the zero point!
- The calibration point must get a maximum distance from the zero point!
What is needed for?
- The sensor must be integrated in the system of the plant.
- The sensor must be supplied with corresponding voltage of data sheet informations.
- The sensor must output a signal. For this, the measured variable must be near the upper limit of the measuring range .
- The sensor has sufficient time to commissioning.
- The measured variable must be stable.
- The liquid must not form gas bubbles.
- The flow to the sensor must be stable.
- A valve for taking a sample
- The transmitter must receive a signal and optimally display it too.
- A device for the reference measurement must be present.
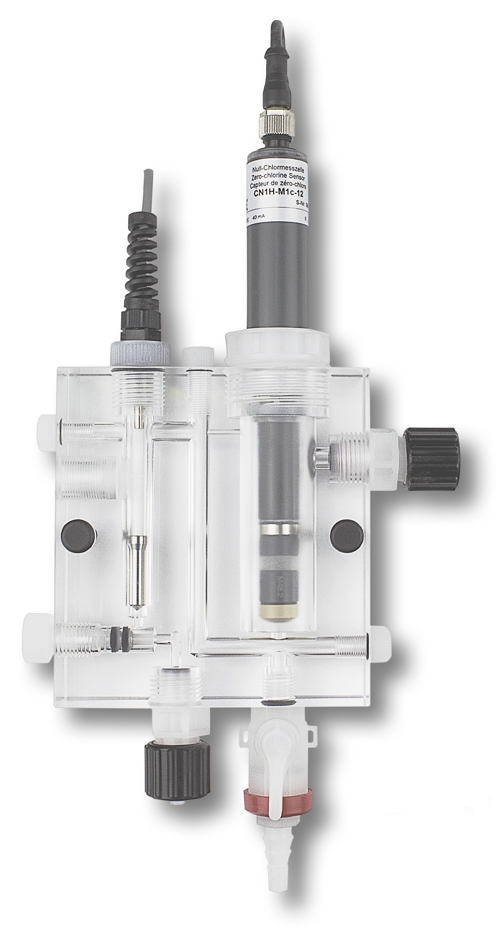
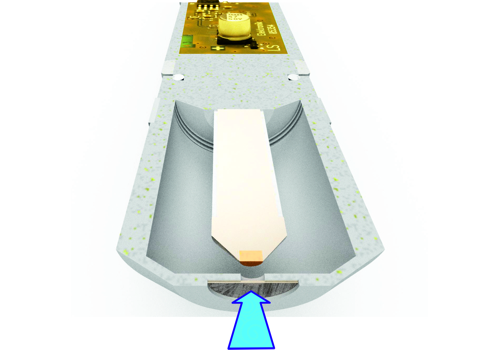
Specifically, for the example of the membrane-covered sensor must applies:
- with the allowable pressure,
- through a 6mm hole at a distance of 15mm,
- with 30 Liters per hour are flowing .
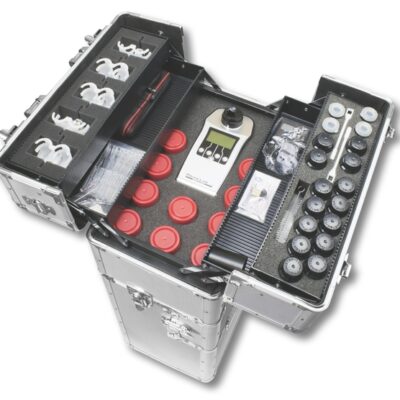
In the photo, a flow assembly is shown, which fulfills and monitors these conditions.
1-Point calibration
If all conditions of page 06 are met, then it's a short sequence!
It is advisable, to use a checklist for the conditions and a log book for the results of calibration. the meter may be equipped with these functions. As an example, the measurement of free chlorine a membrane-covered sensor brand DOSASens with a signal 0 … -2000mV is used.
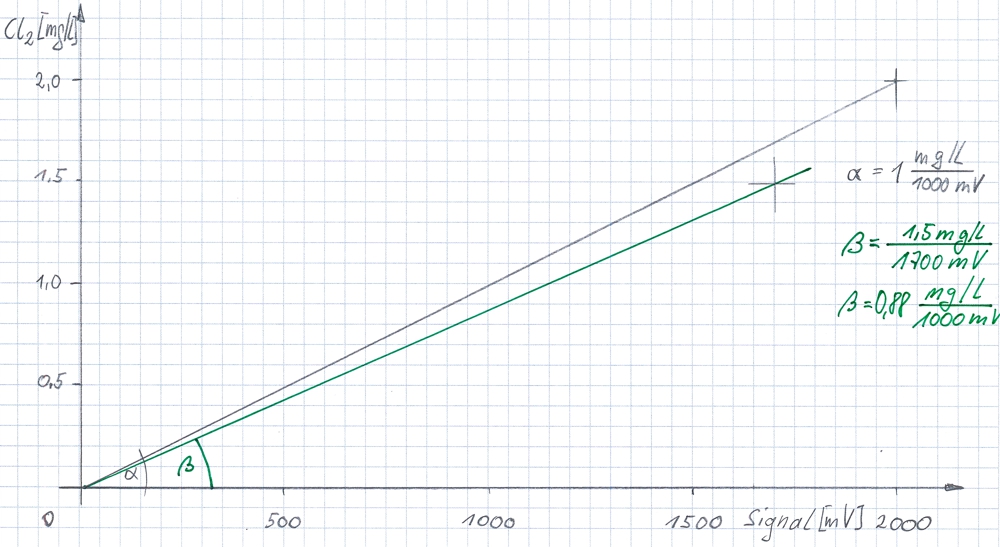
The sketched diagram shows the calculation in the transmitter. The sensor should send a signal of -2000mV at 2.0 mg/l chlorine in the water. The ratio of the two values is the theoretical gradient (or slope) of the sensor (α). The stored slope allows the meter to convert the current signal into a measuring value with unit.
but the current slope of the sensor is dependent on other parameters in the water and the environs. Therefore, each sensor needs to be checked and calibrated after a fixed time. In the example, the slope has reduced. Per reference measurement is determined, that when a signal from 1700mV the concentration is 1.5 mg/l of chlorine (green lines, slope β). This must be said to the transmitter, so that the transmitter calculates the intermediate values on the green line.
Preparation:
- 3 Clean and dry cuvettes. If fewer cuvettes are present, then a bottle with at least 100 milliliters provide, clean and dry.
- Open the photometer and activate.
- Check in photometerthe correct measurement method and set.
- Check the necessary reagents for this method and provide. This should not of course do after arrival.
- Check the operation of the valve for taking the sample and close again.
- call the function of calibrating the transmitter in memory. unblocking of the transmitter with a password possibly may be necessary.
- unlock transmitter.
Execution:
- The current measurement value (in mg/l) and the current signal of the sensor (in mV) write down. Depending on the device, this can only be possible, if the method for calibration has been started.
- At the valve, the sample in at least 3 cuvettes or the larger bottle fill. By changing the flow rate, the signal of the sensor will change. It is therefore important, to remove all the samples simultaneously and very rapidly according to the note of the current signal.
- perform the zero-test with the first cuvette. (all steps according to operating instructions of the photometer)
- Add the reagents in the first cuvette.
- run the test of the first cuvette.
- Write down the measured and indicated value.
- All steps at least 2 repeat times in a short time on the same sample.
- calculate the average from the values of the photometer. Check this value for plausibility. If the value is correct according to experience?
- check the conformity of the current signal of the sensor with the previously recorded signal. Especially in unstable processes may have occurred in changes. If no match then see the section help in correcting.
- Enter the average value in the transmitter and confirm.
- The calibration is usually completed. The transmitter calculates values now using the new pitch.
Work over:
- If no signal or too low a signal from the sensor during the confirmation was available, then some transmitters must be set back to factory condition. A division by zero is fatal especially in old transmitters. Total-Reset!
- If no measurement value during the confirmation was available, then some transmitters must be set back to factory condition. Total-Reset!
- Make a note of the registered average, the signal of the sensor in registration and calculate the slope for these values.
- If the practical slope will be less than 50% the theoretical slope then schedule the replacement of the sensor.
- Write down the time remaining until the next scheduled maintenance of the sensor.
Help for calculating:
If the signal has changed since the removal of the sample, then you should calculate the average correct before entering into the meter.
Value to store = average x (Signal now / Signal at the time of taking the sample)
Mistakes in the One-point calibration
The sensors and measuring instruments are only as accurate as the user!
From the explanations to the reference measurement is known, that an mistake of about ± 0.1 mg/l by the user of the photometer is normal. As an example, the measurement of free chlorine a membrane-covered sensor brand DOSASens with a signal 0 … -2000mV is used.
If not yet done, then test yourself and the photometer by repeating the measurement on one sample. See page 05 for reference measurement.
The mistake in measurement with the photometer is independent of the area, in which is measured. But it affects the calibration.
Best case:
If one at the time of calibration has a real concentration of 2.0 mg/l, then the measured average value may be in the range between 1.9 mg/l and 2,1mg/l . The calibration would the real value with a maximum mistake of 5% calculate and display.
The sketched diagram shows the case for our previous example with long red lines to the point 1.5 mg/l with -1700mV.
If you calibrated at 2.0 mg/l, then it was in the range 0.5 mg/l the relative safety, to be between 0,525mg/l and 4,975mg/l.
Middle case:
If one at the time of calibration has a real concentration of 1.0 mg/l, then the measured average value may be in the range between 0.9 mg/l and 1.1 mg/l. The calibration would the real value with a maximum mistake of 10% calculate and display.
The sketched diagram shows this case with an extension of red lines to the point 1.5 mg/l with -1700mV.
Worst case:
If one at the time of calibration has a real concentration of 0.5 mg/l, then the measured average value may be in the range between 0.4 mg/l and 0.6 mg/l . The calibration would the real value with a maximum mistake of 20% calculate and display.
The sketched diagram shows this case with an extension of red lines to the point 1.5 mg/l with -1700mV. Here you can see the distance of the extension to the point. If you calibrated at 0.5 mg/l, then one has in the range 1.5 mg/l, the releative security between 1.8 mg / L or 1.2 mg/l to be.
Impossible case:
If one at the time of calibration has a real concentration of 0.1 mg/l, then the measured average value may be in the range between 0.0 mg/l and 0.2 mg/l . The calibration would the real value with a maximum mistake of 100% calculate and display. In practice, the uncertainty would between 0.0 mg/l and 0.2 mg/l.
The sketched diagram shows this case with an extension of the upper red line. The point 1.5mg/l with -1700mV can not be achieved. The enclosed area between this line and 0.0 mg/l is so large, that no indication of a realistic value is possible.
Remedy:
- It is possible to reduce the individual errors on the photometer, in which the number of measurements is increased. The average value is more correct.
- You can increase for the time of calibration the real concentration in water. The linearity of the sensor is available near the zero point too. This you can use.
- If the controlled system does not allow increasing the concentration, for example in the measurement of ozone, then a second smaller circuit with a separate tank can be used for calibration.
- Some transmitters can be without reset from an incorrect calibration “court”, if connecting an faked signal and calibrated to a logical value. For example -1200mV of a correctly polarized battery and 1.2 mg/l.
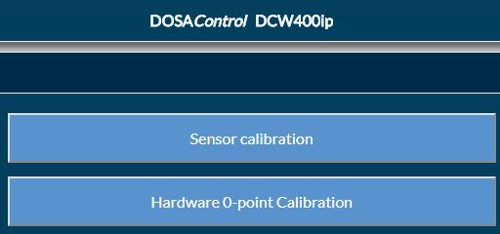
Zero-point calibration
The zero-point calibration is not required!
Membrane-covered sensors DOSASens brand and other German brands have an electronic zero-point adjustment. This means, that at 0.00mg/l exactly 0mV or exactly 4.00mA be spent.
The transmitter:
The evaluation of a voltage with respect to 0 mV or 4.00 mA is not easy. The component tolerances, temperatures or humidity, can move the measuring value of the transmitter in a few millivolts or a few uA. High-quality brands achieve in DIN IEC 60381 Part 1 and 2 described tolerances .
The most common misconception:
The most common misconception concerns again the transmitter. If no sensor is connected, that means not, that 0mV or 4.00mA received. The mistake, that an open current loop transported 0,00mA, is recognized usually quickly. But the mistake, that open contacts always provide some (but rarely) a zero value for millivolts, can produce headaches.
Remedy for the mA signal:
If you nonetheless suspected a mistake here, then you have to connect a high-quality simulator for the mA signal to the transmitter. Deviations of ± 5μA are allowed according to standard. The simulator should therefore work with an accuracy of ± 1uA. If the deviation from 5μA was found, then the transmitter can be claimed by the manufacturer. The test protocol of the simulator should be attached to the complaint.
Remedy for the mV signal:
Control of the zero-point here is easier. It is only necessary, to connect the two poles electrically for the signal and signal ground.. This balancing of the potential yields 0 mV, which should be displayed on the transmitter. It is recommended, include the cable between the sensor and transmitter in this test.
Quality transmitters have the opportunity, to compensate for small errors because of the influences of the environment and the cable. This transmitters or controllers have for this purpose eclusive a “Zero-point calibration”.
Pay attention, this method can not be applied to a mA input! The electrical connection could destroy the hardware.
Process understanding
is the prerequisite for a successful calibration!
Calibration means primarily “to compare”! Not "apples to oranges" but one signal with a second signal!
Easy it is, if one can use a reference fluid having previously set concentration. This liquid must of course be durable and be available. Examples include buffer liquids for the pH or the redox value. This method is often used for ion-selective electrodes.
A second possibility is to, determine the concentration with a second measurement process. For free chlorine, the DPD method is usually used.
Understanding the chemistry on the process side.
When free chlorine is added to water, then with the intention, to disinfect. When dissolved iron or manganese is present in the water, then these substances are first oxidized and disinfection must wait. No measurement will show free chlorine, although it was present.
When free chlorine is added to water with plant fertilizer, then it goes immediately to the existing ammonia into a (strong smelling) connection. The membrane-covered sensor is not reporting free chlorine although it suggests the nose. The DPD measurement will show no free chlorine in faster execution, but what changed it after about one minute to an error.
If free chlorine is added to water with very high pH, then dissociated to the chlorine ion OCl-. The DPD measurement will determine, that free chlorine is present although no desinfectant effect is visible.
Understanding the chemistry on the reference page.
For the DPD measurement varies with the first Supstanz the pH of the sample, so that the ion is transformed into the hypochlorous acid. The DPD method does not measure free chlorine but the oxidative action of hypochlorous acid to the dye N-diethyl-p-phenylenediamine. A good membrane-covered sensor measures on the other hand over a broad pH range with little dependence free chlorine directly. The pH movement can be compensated for in an appropriate regulator. See page Innovative products DCW 400ip. All interactions can not be displayed, but the following example should explain the system.
Sea water with chlorine disinfection
Is real sea water in the pool and chlorine is added to disinfect, then the following occurs:
Such as chlorine and bromine is found in nature only in the bound form as the bromide, for example, as AgBr. In sea water about 68 mg/l as Br- existing. Bromine is less reactive than chlorine. Therefore, chlorine is capable of, to displace the bromine from the compounds. If is free chlorine taken in the sea water is the chlorine in chlorides (Salt) bounded and at the same time, bromine will be free. Disinfection effect is taken over by bromine. A not-pool example of the reaction:
2KBr + Cl2 → 2KCl + Br2
The place-exchange of chlorine and bromine remains unknown of the DPD measurement, because it is the same method and the same dye used for chlorine or bromine, N-diethyl-p-phenylenediamine. If one method “Chlorine” adjusting, is still to display a value for bromine on photometer. If you adjust the time on the clock, you find yourself still in the same place on the earth's surface.
A good membrane-covered sensor differs bromine and chlorine. If a chlorine sensor used in the example, this sensor is no concentration, for there is no free chlorine available. It is therefore important to know, that one can determine the concentration of the disinfectant with a bromo-sensor.

Sea water with ozone disinfection
Even when ozone process unwanted byproducts must be considered. The bromides of the sea water react in a first step to hypobromous acid:
Br– + O3 → HOBr
Now you might suspect, it works like the chlorine. But in a second step, the hypobromous acid is further oxidized to bromate. (This bromate is toxic and is subject to national limits in drinking water.) The process can be quantitatively very difficult to calculate.
HOBr + O3 → BrO3–
The question arises, where is the ozone? In the hypobromous acid or in bromate? Perhaps the hypobromous acid has already reacted with the ammonium and exists as Bound bromine (comparable with bound chlorine) out.
Or does the ozone reacts with the chlorides to HOCl?
In sea water but also iodide, about 0.5 mg/l. The ozone also reacts with the iodide in the first step to hypoiodous acid HIO.
Is the ozone bound in iodine? What won this lottery? This chemical knowledge must be known before the use of ozone to be. Neither is this knowledge to be replaced by a DPD method or by a membrane-covered sensor for ozone.
If no ozone is present in the water , then can and should a membrane-covered sensor show no ozone! The statement “suited for seawater” does not mean, that the chemical relationships can be overridden. It just means, that the sensor is not destroyed by salt water.
If the DPD method is to be used as a reference, then the iodide process is exploited. The water sample is added by potassium iodide. Existing ozone forms hypoiodous acid. The hypoiodous acid acts on the dye N-diethyl-p-phenylenediamine.
But bound chlorine and bromine bonded act similar to potassium iodide to form hypoiodous acid. The 3 sources bromine, chlorine and ozone thus form at the end hypoiodous acid. How much of the ozone can be attributed, can not calculatable.
In this case, the DPD method display via the photometer “any” cause of hypoiodous acid plus the hypochlorous and hypobromous acid. Most likely no ozone is present in the sample.
A good membrane-covered sensor shows ONLY the ozone in the sample. Although ozone is dosed, it is within a few milliseconds no ozone present. The sensor will show nothing! Are these relationships not known, the error is sought in the sensor and not with the chemical ignorance of the process .
For the DPD method substitute the Indigo trisulfate method could show better results for the concentration of free ozone. On the sensor side, one can try, to recognize the disinfecting effect with a bromine-sensor.
Leave a Reply
You must be logged in to post a comment.