Published in: Das Schwimmbad und sein Personal, edition 10/2018
… and the many pitfalls to these daily handles.
In each water treatment facility of a public swimming pool needs to be done: Measuring and logging water chemistry. In previous articles, we have often discussed it, but always on the edge and not focused on the activities of calibration. Because even the terms "are the ghosts", the one speaks of the calibration of the sensors, the other one speaks of the calibration of the controller. I think the latter is right.
Unlike in the past contributions, Today it is not even in the depths of preparation and planning in the swimming pool. Does not temperature, pH value, Chloro-value or redox value is, should be relegated to a later date. But now from the start:
Terms:
Found in Wikipedia: „Calibration in metrology is a measuring process for reliably reproducible detection and documentation of the deviation of a measuring device (Sensors) … over another device (Referenzmessung), which are referred to in this case as Normal. In the definition … belongs to a second calibration step, namely taking account of the deviation determined in the subsequent use of the measuring device (Transmitter or regulator) for correction of the readings. Calibration is performed without intervention, which changes the meter.“
with own words: Calibration is the process, wherein the signal from the sensor is compared with the value of a reference measurement. This deviation is passed to the controller, so that calculate a transmission factor from the signal and the deviation and can use for display or control.
All we need, is therefore a useful
Reference measurement
... and sufficient knowledge about this method. Please do not laugh at this point, You do not believe, how widespread is the misconception to-powerful DPD measurement. small test: Asks in your family motorists: "What is the clutch in your car?"And counts, what proportion of the answer "This is the (left, middle, right or for automatic drive -I- missing) Pedal!“ hat. The correct answer would be something like: "The clutch is a component, that the power transmission between engine and transmission at- on or off. "I was active in the 90's as an instructor for master car mechanic at a Chamber ... and I know the error rate among the professionals of the first semester.
For the reference measurements are in the field of public baths two main methods:
- It has a liquid, contains a concentration precisely defined or
- is measured in another method, the concentration of the current liquid.
The prepared liquid is most commonly used as a reference for pH or redox values. We deal later with the pitfalls of these two measurements. But let us number (2) start. First the simple question:
Why is there no reference liquid with 0.5 mg / l free chlorine?
Because "free chlorine" a concept of art is. In the article for disinfecting (and of course in the relevant textbooks) are a few explanations, only so much: Free chlorine is dissociated, in Cl2, HOCl und OCl–. In addition, as also the other products of chlorine, for example chlorides, Chlorite oder Chlorate, which could form independent of our desires in a reference liquid. So we are left with no choice, as the
DPD method
… to use. What's this? DPD is the abbreviation for the dye N,N-Diethyl-1,4-phenylendiamin, responsive to the disinfectant with a change in its color. Sounds like science, the operating instructions of the devices is understandable, So nothing can go wrong, or? So you go to the swimming master's assistant or apprentice motivated and measure! Perhaps first we start thinking about why the importance of this measure.
First goal
Is it about that, to control, if our value is within the standard? According to DIN 19643 so between 0,3 and 0.6 mg/l? Then everyone is happy, if the result is a number in the desired range. What is happening, unless? Without insinuate something, the apprentice motivated measures a second time and is pleased with the results. But the unmotivated apprentice takes the pen and writes a requested number in the operating log. This saves time, switch the controller. If the claim ends here, the simple test kit is recommended that. The result is through the rough division open to all interpretations. (Do not prompt!)
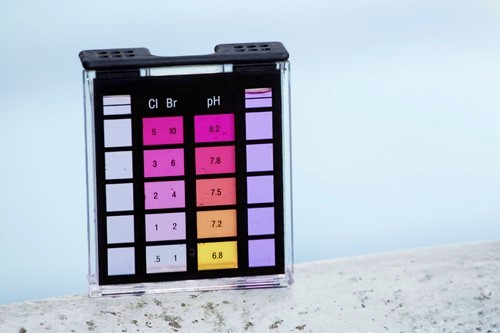
Photo 1: visual DPD color comparison, Source: Fotolia
Or is the goal, to allow for the time until the next calibration exact possible regulation of the chlorine concentration?
Let's look at this question in the DIN 19643-1:2012-11, 11.4.2 Data acquisition, we find the heavyweight sentence: „An adjustment of the sensor must be performed, if there are discrepancies between the display device and the results of the daily photometric control measurements using the DPD method.“
Honestly, I am determined, this time to put the words of DIN not in a bad light. Those who act according to this rule, gotta ... (piiieep). Especially if these deviations should be defined by the next sentence "The error limits must be less than 0,05 be mg / l free chlorine."These unrealistic cries for me just by the method" unmotivated Apprentice "!
real purpose
A secondary goal could be, to reduce that risk of under-dosing, and thereby protect the bathers better. But the reduction of the consumption of disinfectants is a legitimate economic and environmentally-relevant target. Unfortunately, not everything can be attributed to the motivation of the apprentice described above. From the address to the conscience now to appeal to the systematics of the project.
Yes, I can hear the outcry. All professionals have a good photometer! Two decimal places on the display guarantee accurate results.
No, they do not!
The photometer are precision instruments, determining the color in the vial very carefully. But what color is produced, this is the manual activity (correct handling) responsible. The company has SBF 2012 (Fischer, AB Issue 6/2012) a sample of 22 individuals can be evaluated by DPD and a maximum deviation of ± 0.1 mg / l determined from the mean value. come now, probably for economic reasons, Rare 22 Staff at the poolside together and examine the same time a sample. 22 Individuals have just 22 different results. Back in reality, what if a staff member checks the sample 10-fold?
we call the employee Sabine and show the results in this graph:
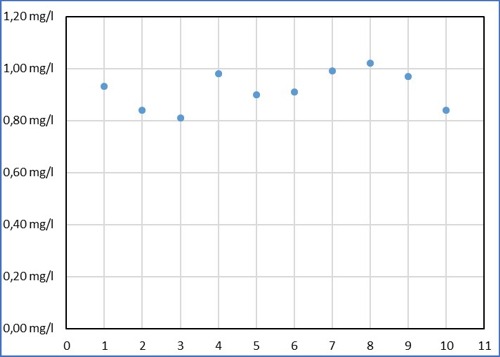
Diagram 1: Sabines values
Despite all the effort Sabine measured in a range of 0,21mg / l around its average value of 0,92mg / l. Then Armin came up and thought, that this is far too inaccurate. (Names are fictitious by the editors, Similarities are intentional!) Armin has entered its results of the same sample as yellow dots.
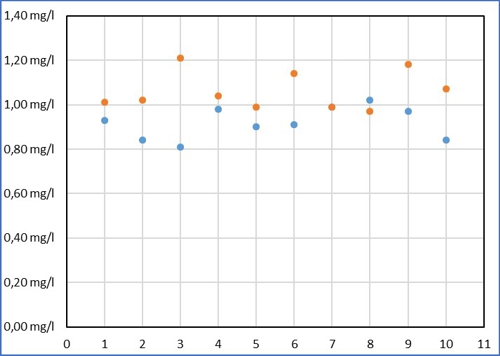
Diagram 2: common values
The values of Armin are higher on average, he comes to an average of 1,06mg / l. But his values fluctuate more strongly in a range of 0,24mg / l. also applies to Armin, the average is just LIKELY than the ten individual measurements. No one can predict, how close the individual measurement is to the mean. With practice you can probably reduce this scattering, but then you also exerts its individual errors with a. So it is not boring, remain Sabine and Armin for this article without exercise.
Now it is only on the distribution of authority between Sabine and Armin, which mean prevails. The amazing thing is, neither has determined the correct value. Because there is no comparison, what and what is right wrong. Maybe later, when the health authority comes with its maximum authority and a sample evaluating, can you talk about, how far Sabine and Armin's values on the value of authority are removed.
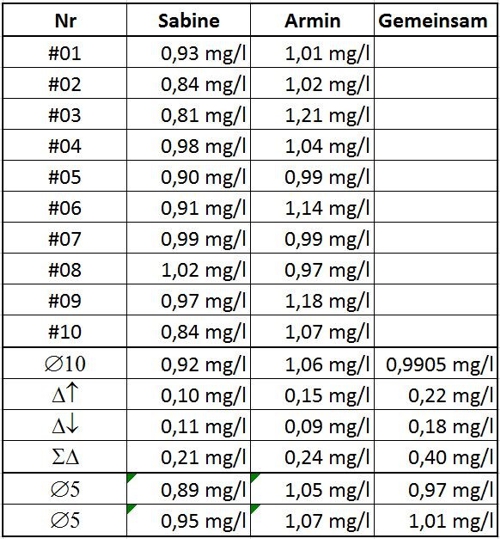
Table 1: Values of Sabine and Armin
Let's assume, Sabine and Armin are a couple and want all 20 summarize values. Not a good idea! Because the average would 0,9905mg / l but now with a possible variation of 0.4 mg / l. Sabine and Armin notice the mistake and
because this work is carried out mainly by Sabine, some relying on measurements Sabines.
Again, "has the saying that too many cooks spoil the broth!true ". we draw what conclusions now from Sabines measurements?
In plain English:
When Sabine later next sample (#11) evaluates once with a value of 1,20mg / l, then in reality the measured value of the lower edge of their personal scattering can be (#3 in the graph below as) and a value of 1,41mg / l is possible but less likely. but if the measured value is random, the upper edge of its dispersion (#8 in the chart below for ¯), then a real value of 0,99mg / l is less likely but also possible.
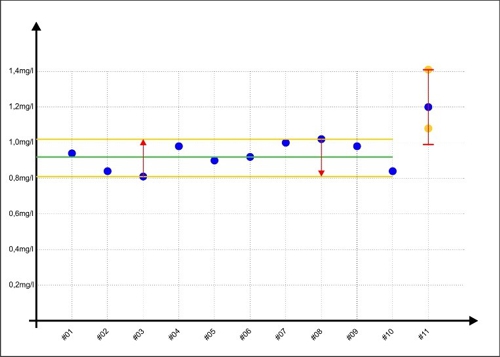
Diagram 3: Error-range measurement with #11
This area for #11 is shown as a red double-T in the diagram. The yellow dots show examples, what values are also possible. to get too close without Sabine, no matter the concentration of the disinfectant in the sample is real contain, Jane's range of error will always be ± 0,21mg / l.
Fortunately, this is true of all us. Unfortunately, it also applies to the authorities, but practicing almost daily with the photometer to happiness. Back to Practice. The steps up to the knowledge, what personal deviation you yourself on the photometer, be sure to be already covered in each operating log, or? Can you even make up ... The following are the ...
effects.
Not inadvertently Sabine as Sample #11 obtain an assumed concentration of 1.2 mg / l. At this point the double-T in the previous chart looks so beautiful harmless. What is happening, if the concentrations are small? In the next chart, the samples are #12 to #21 shown with the error range.
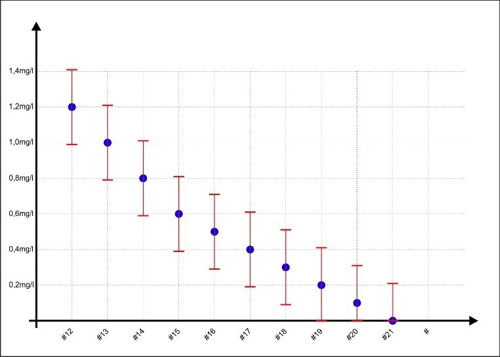
Diagram 4: Error range at lower concentrations
If Sabine draws a sample and measures the concentration, what result guarantees compliance with the limits 0,3 ... 0.6mg / l? None! For each measurement may be at the top or at the bottom of the dispersion. visible example: When Jane has a display of 0.2 mg / l on the device, then 0,41mg / l or even may be NULL milligrams per liter in water. Only helps one:
forming mean!
To remember, whether our average 0,92mg / l of 10 measurements (ø10) correct is, no one can know. So we explain this just now time is right. If we consider the first three values for a mean (ø3) want to use, then the result of 0.06 mg / l is removed. But even with the first five values as mean (ø5), is the result of 0,89mg / l. So only 0.03 mg / l from the declared reality. In the past 5 Measurements is the deviation happen to be identical.
Sabine has therefore decided, now their trial ever 5 Time to analyze and to form therefrom the mean value. The error range is shrunk by a high probability to 0.06 mg / l. In remembrance: A deviation from an almost random amount of personal earnings. With the accuracy requirements of DIN which is not related!
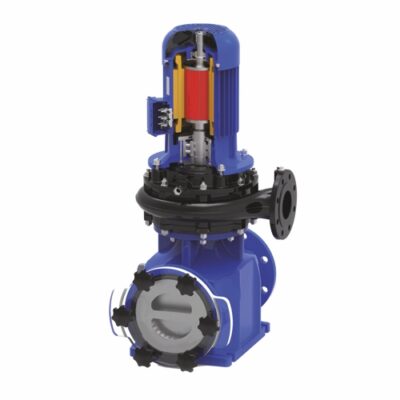
Before Sabine transmits this average value to the controller, Knowledge about the function of the sensor necessary. As an example, we use a membrane-covered amperometric three-electrode sensor.
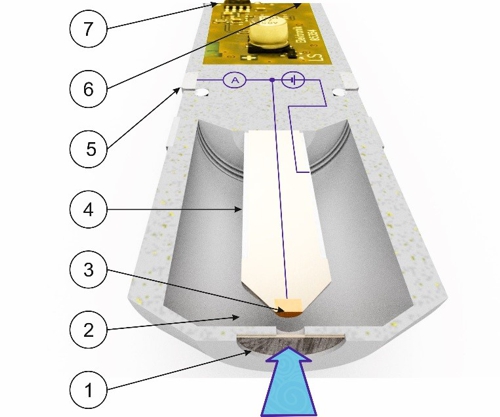
Graphic 1: Schematic structure of a sensor, Source: aqua&pools
A nozzle of the flow-through chamber with 6mm diameter approximately 15 millimeters distance brings a constant jet of fluid (symbolized by a blue arrow) with the disinfectant in a direction plumb to the membrane (1). The membrane allows molecules of the disinfectant mainly pass through . These molecules put a pathway in the electrolyte liquid (2) to the working electrode (3) back. The working electrode (3) is of precious metals (gold or platinum) so they do not corrode. The working electrode (3) is with a very small but accurate electrical voltage. Therefore, the disinfectant emits electrons at the surface of the working electrode. These electrons flow in the 3-electrode system to the counter-electrode (5) and forming a very small electric current. The counter-electrode (5) be seen as a ring made of stainless steel. By this method, the reference electrode (4) kept current-free. The current is measured and the temperature to an electrical signal (6) processed. This signal may be a standard voltage signal from 0 to -2000 millivolts or a standard current signal 4 to 20 be milliamps or a standard bus signal "Modbus RTU". Depending on the type of the output signal is a voltage supply (7) required.
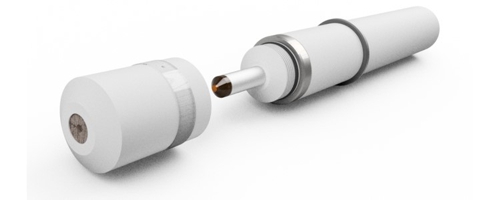
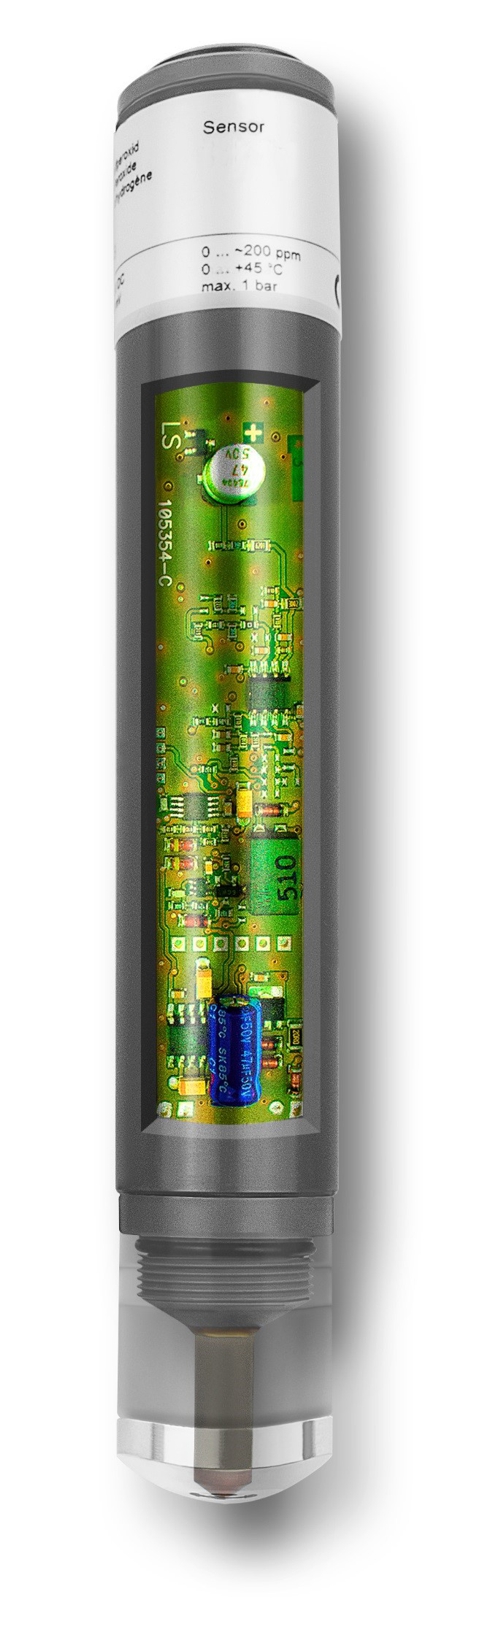
Graphic 2: open membrane-covered amperometric sensor, Source: aqua&pools
Importantly the output signal. Regardless of the manufacturer of the membrane-covered sensor, the output signal is always proportional to the concentration of the disinfectant. Asia, of course, sensors are available with the same name, but not everywhere where it says "membrane-covered", is this promise in there too.
My positive example to a sensor of the DOSASens CC1 brand with a signal 0 ... -2000mV and a nominal range of 0 ... 2.0 mg / l within. Thus, this sensor provides theoretically at zero point at 0.0 mg / l, a voltage of 0 mV and 2.0 mg / l, a voltage of -2000mV.
The big moment
… has come. Sabine has drawn a sample during operation, analyzed and the mean value (ae5) calculated with 0,32mg / l. she knows, its error range is likely ± 0.03 mg / l. This 0,32mg / l to transmit the moment to the controller X. At the same time the controller receives from the sensor a signal from -350mV. In the graph, it looks like this:
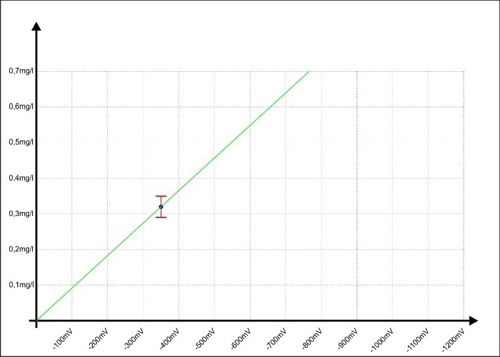
Diagram 5: Calibration of the regulator at -350mV
When a button of the controller combines the two values

This ratio a, it is also referred to as the slope of the sensor, is stored as a factor in the controller. Da membranbedeckte amperometrische Sensoren, as already described, at 0,00mg / l concentration of a signal output 0mV, A second point is present, so that a straight line can be calculated.
The controller can be calculated from the straight line in the chart for each signal has a value. In the diagram 5 this is precisely marked green. One might think, Here, the contribution may end.
A trip to New York
but sometimes it is not only important to know, where you are, but also where they might be. As ships have navigated by the stars, this desire has literally "developed in the Mist". A trip from London to New York with your 5500km in a straight line has about 20 days lasted. These are 275km per day. With clouds or fog over the water, no one was able to (back then) determine exact location based on the star. For all younger, a GPS display was not at the wheel wheel. The reference measurement lacked.
Only the experience of estimating the speed and skill of the helmsman in maintaining the direction could bring the ship to the destination. Even then, no apprentice felt like, reflect on the errors. If the estimate ± 10% was exactly, was the error range "only" big 27,5km. But it makes a difference, whether on 20. Day the ship (20 Day x 27,5km =) 550had km of water between the ship and New York (-) or is theoretically driven on land already 550km (+). So the experienced captain knew, later than that on 18. had day needed a reference measurement at the stars or continue VERY CAREFULLY.
Sabine knows her fault area
Therefore, she knows, the reality that at the moment of entry could also be 0,35mg / l or 0,29mg / l. The underflow makes Sabine not uncertain.
For better illustration we look at the representation of the temperature forecasts of some TV channels on. There, the expected temperature is shown as a green line, but informed the audience with a wedge, in which range the temperature may be in the next few days.
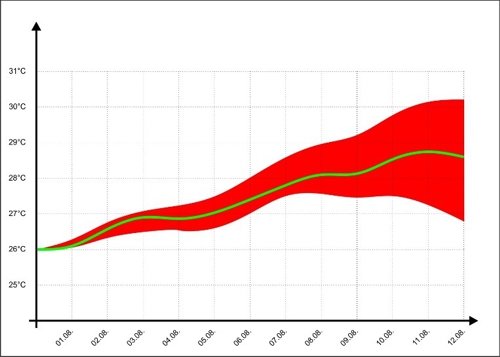
Diagram 6: Error range of temperature trends
We contribute to the two red lines in the "Diagram 7: Calibration of the controller with error range "and see, that the error with larger millivolt signals is increasing.
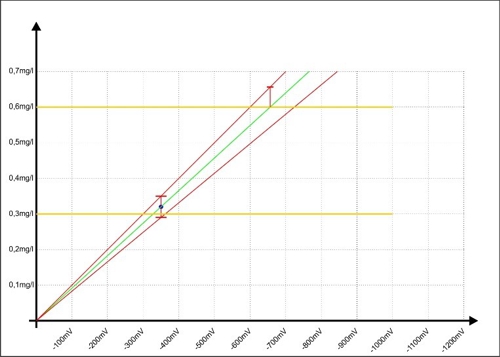
Diagram 7: Calibration of the controller with error range
If the controller indicative of a measured value of 0.6 mg / l, then the error has nearly doubled to ± 0.06 mg / l and the reality could be reached, the measured value at 0,66mg / l.
Laziness is innate to all people. The question, Why 5 time measure, if it is then no one sees, will face daily in each. This will make it clearer, here in red of the unsafe area, when Sabine had worked exclusively with a single analysis.
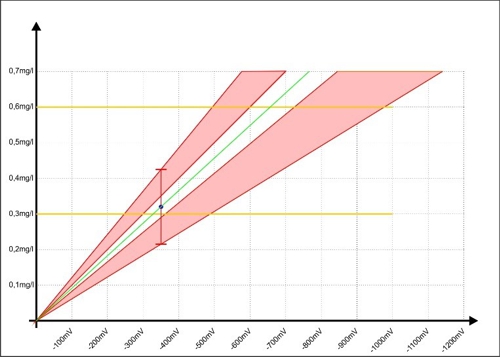
Diagram 8: Calibration of the controller with inaccuracy of the single measurement
Armin has attached graph for Sabine in the lid of the photometer. It motivates them so much, Sabine that now their ...
increase accuracy
… will. Sabine knows her fault area. Before she takes her sample Sabine respects so on, that the concentration of the disinfectant near 0.6 mg / l. this alone it can further reduce the error range in the controller. The measurement is shifted, the red areas now display, which improve the accuracy was achieved with this small change.
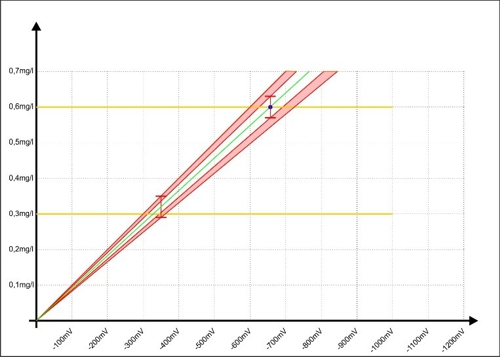
Diagram 9: Calibration of the regulator to the upper measurement accuracy
We now have the human error possibilities at the reference measurement sufficiently illuminated. Of course, it is obligatory, to also take a critical look at the sensors. What gives me, to use a thin green line on the graph?
It electronics in the sensor, that enables and makes a big difference to systems without electronics in the sensor. Who wants to deal more deeply with these differences, within a Tutorials on these sensors the differences are described in detail here.
Despite all the advantages, there are electrochemical sensors, like all technical systems are subject to wear. This natural wear relates to the electrolyte in the membrane cap. The very slow chemical change of the electrolyte causes an attenuation of the signal. If on the day of start-up may be the signal 1050mV at one milligram per liter, it may be, for example, 995mV one month later. This process is under the terms of a swimming pool very slowly. The specialists speak of, that decreases the slope of the sensor.
Graphic 3: Structure of a membrane-covered amperometric sensor, Source: aqua&pools
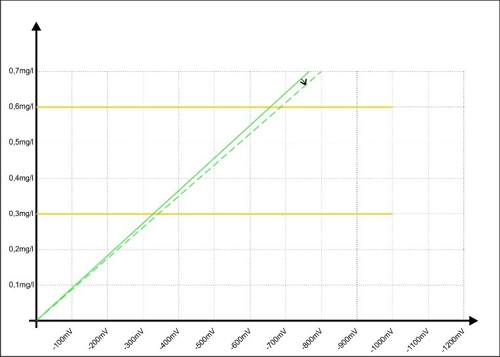
Diagram 10: Variation slope of the sensor
With each new calculation of the ratio on a button in the controller, the deviation is canceled.
What are the most common technical error?
Of course it is at home: The manuals of photometer, Sensor and controller is not read. Our members rarely occurs, but many users lack the knowledge of the process.
Reading the manuals would avoid, that rated the reference value incorrect. "Deny" Some regulators silently accepting the new factor, when the big change of the reference value to a manual error indicating.
This question quite often includes, please do not laugh, the reason "false disinfectant measured" and "photometer not correctly set" or "nulling uses".
Especially often ignored, when the sensor has no signal (and may have). The mathematicians among us know, that division by zero never ends well. Some regulators intercept this error in the algorithm, other then need a factory reset. The cause is often a
- not or incorrectly performed commissioning or
- incorrect cable connection or
- lack of conditions for the sensor.
It is so simple: Modern controllers show the signal of the sensor in the display. But all this is nothing compared to ...
Failure to comply with the time!
When Sabine draws its sample, 5-analyzed times, manually calculates the mean value, at least 10 elapsed minutes, until he can press the calibration button. During this time, maybe the conditions in the pool have suddenly changed or the regulator plays "madman Ivan"And provides for no apparent reason all machines Stop.
Then, the signal of the sensor may represent a completely different concentration as the, the Sabine has laboriously calculated in their sample. At the end of the work was for nothing! Solutions in the text below.
The biggest tactical error!
Is there anyone, believeth, it was about the determination of a correct concentration of disinfectant? Then that someone might argue with considerable differences with the authorities about, what concentration the correct concentration. Sabine has recognized in our history, that it's all about the proximity to the regulatory control. Instead of fighting it draws its sample intentionally at the same position in the basin, at the same time, under the same conditions with the same temperatures and their compensations. in short, it mimics the authority to, to get almost identical results. Their common goal is it, to calibrate these values, the controller.
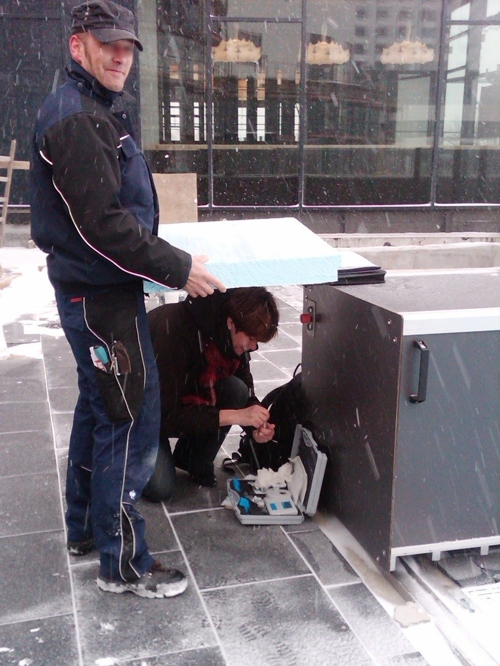
Photo 2: DPD measurement of the authorities under the most adverse conditions, Source: aqua&pools
If the authority takes the sample in the basin and the controller is far away, then Sabine has a problem - and 3 solutions:
Emergency remedy to the problem of time
OK: Armin! Before you start make both in the style of a bad detective stories a synchronizing clocks and embark on their locations. At the same time = X at 00:00 listed Armin the signal of the sensor and Sabine takes the sample. When the average is calculated,
then stares at the more patient of both, also Sabine, on the screen of the controller and waits until the signal again with the listed value matches ... and then presses the button.
Requirement: The controller displays the signal. Unless, then one should read out the signal of the sensor properly to the terminals of the controller with a multimeter ... or incorporate modern controller.
Intelligent remedy to the problem of time
Here, too, Armin's help while recording is required. If the waiting time until the basin has calmed down is too long, arise two ways of abbreviation. The practical method is, to simulate the signal of the sensor with another device.
The intelligent Method is the ratio calculation. Index "0" is the time of sampling, Index "K" the time of the "Calibration" or "button-pushing". "S" is signal in millivolts, and "W" of the value of the concentration is described in milligrams per liter. The ratio looks like this:

Armin hat S0= -350mV recorded during Sabine, as at the beginning, an average value of W0= 0,32mg / l has calculated. They even had time, casually together for coffee and discuss the results. A view of the controller shows a relatively stable signal from now 432mV. The concentration of the disinfectant is thus increased in the meantime. No panic, Sabine, the formula like this and determined:
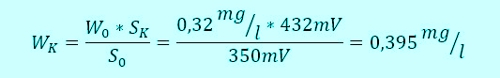
This value is Sabine at 432mV into the controller and to save the waiting time.
Elegant remedy to the problem of time
is elegant, when Armin is not needed. First option, the controller stores the signals with a time stamp and can Sabine W0 later simply read and use in the calculation.
Second option, Jane can see from anywhere in the pool the current signal, write down yourself and use in the calculation.
third option, Sabine can tell from any place in the pool the regulator "I am now taking the sample", the controller calculates the signal and memorizes WK at the end even self. You guessed it certainly. Is there already!
Described in the article to Internet of water, now known as DOSAControl DCW 400ip.
Calibration pH sensor
After so much theory, we make it easier. Here you need 2 Liquids having different pH values. Mostly 4,0 and 7,0, but others are possible. This depends on the freedoms of the regulator, what values he can use. The two pH values, the controller assigns a voltage in millivolts to and calculates a straight line from these points.
Frequently it comes to (false) opinion, that the measured value must lie between these points. Conversely, it is the concentration of a liquid would have to lie above the upper limit. What is thereby often not considered, are the shelf lives of the fluids and their costs. The higher the pH of the buffer liquid, the lower the shelf life and the higher the cost.
is again carried out with the life the slope decreases. In contrast to the membrane-covered amperometric sensor but the electrolyte can be replenished only when purchasing additional costs.
Probably a rough accuracy is already sufficient for the authority. but it is the pH of the water used only to assess the effectiveness of the free chlorine. In rare cases an ad or valued the effectiveness of disinfection.
Calibration ORP sensor
You could actually calibrate the ORP sensors. These liquids are available with defined values as 468mV. When the controller has built a factor for converting, which is often not the case, then the signal can be changed. But why?
In the redox measurement, the signal is used, it is also the value! The signal is formed from other factors, which can not be included in a reference liquid. The (DIN 19643 for the lower pH range) prescribed value of 750mV may well be achieved entirely without the presence of chlorine. Moreover, the signal from the ORP sensor is not linear, so not really suitable for a regulator. For comparison:
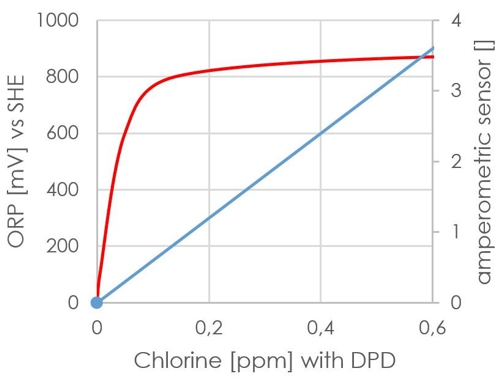
Diagram 11: Waveform redox
The red line indicates the signal. It has significantly exceeded the 750mV even at 0.1 mg / l to DPD.
This effort can be saved Sabine, she has seen from the data, that its redox sensor works and already without calibration indicates a plausible value about 750mV.
practical recommendation
Armin and Sabine are dissatisfied with the effort, they have to operate because of a clause in a DIN. The have a very precise sensor, they regularly maintain, but they only have a very elaborate reference method. I would both, when they ask me to, recommend the following "interpretation" of the rules.
- buy good regulator, Armin thus need not always be there.
- One-time control of its own error range at the beginning of each season 10 measurements.
- At the beginning of each season, an initial calibration, best with the mean value (ø10).
- Daily DPD measuring the concentration. If the first result in the intended area (0,3 ... 0.6mg / l) then no further action. Because the sensor is already accurate and long-term stability.
- If the first value is not in the field, then the average of 2 … 5 make measurements on this sample. If the average value is in the range, then no further action.
- Even though the average is not in the region and significantly different from the value of the controller, then (and only then) recalibrate the controller and save the factor value / signal or record.
- After each calibration control change for pre-factor and rate. When major changes seek causes and may adjust the timing of the maintenance of the sensor.
One might think, Here, the contribution may end. But in this world are not only Sabine and Armin road. As usual, it is followed by a trip to another branch. Here already switching to other disinfectants enough as ...
Bonus-Material.
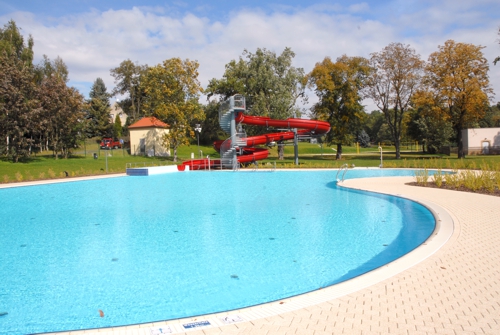
Because the city wants to exploit the system better, is by Hans-Georg in the city administration, the small pool of our example as a therapy pool with 28 ... offered 32 ° C. needs to revise the water treatment plant Axel by the engineering firm and the system is provided with an ozone dosage. Before an activated charcoal filter is enough ozone (1,0mg/l) dosed. According to DIN 19643-3:2012-11, Paragraph 4.4.4 must after a reaction time of 3 min before the activated charcoal filter at least 0.3 mg / l to be left. The activated carbon filter should then take in as much ozone, that remain less than 0.05 mg / l ozone in filtrate.
Note "j" at this point 4.4.4 could be understood, that a DPD method should be used, takes into account the parallel presence of free chlorine. This is something irritating, because the dye DPD responds to both. For the method according to Palin, a manganese(II)diphosphate complex react in an acid medium with ozone in the direction violet. In Sabine's manual for the photometer, this method is not described, Money for another photometer is not planned in the budget by Hans-Georg, So Jane must make do differently. but it has been found with their current photometer over a short shutdown of the ozone dosage, that in any case no free chlorine through the activated-carbon filter is. Then, so you can use with the necessary creativity and the DPD method for ozone.
Sabine has immediately set to work after commissioning of the ozone plant and their error limits for (AE10) also intended for the ozone. Because apart from a few details everything has remained the same (and we can expect easier with the first example) it is with the mean (ae5) to the same ± 0.3 mg / l O3 satisfied.
For the measurement of the concentration in the reaction vessel with 1.0 mg / l Sabine can lean back satisfied. But how is he to know now, whether the 0.05 mg / l limit value is maintained in the filtrate? Each DPD result is greater than 0.02 mg / l may involve an exceeding!
On top of that, looking for Remedy sees Sabine in the instruction manual of the photometer and finds, that there is a lower measurement limit described. Of course, the border of the device is shown at 0.05 mg / l.
The measurement by means of photometer can Sabine, at least to ensure safety for bathers, Do not use.
But, To make matters worse,, it says in the DIN 19643-3:2012-11 4.7.4: „Throughout the filter run in the filtrate must in Table 7 Listed values are respected."Should Sabine measure hourly daily or Better Now? Hans-Georg takes into account the additional expenses? But Sabine remembers the experiences of chlorine and uses a membrane-covered amperometric sensor for ozone "DOSASens OZ" and immediately builds a switching of the sample water supply with a few tubes to. During the calibration, the sensor operates with water from the reactor 1.0 mg / l. if the membranbedeckte amperometrische Sensor then the filtrate, the theoretical error-area is monitored for a maximum of 0.05 mg / l decreased to one-twentieth. These are ± 0,0025mg / l. usable!
The see the bigger picture!
Often we're all stuck in the swimming pool mindset. The active carbon filter does the job, if NO ozone is found in the filtrate. So the goal of this measurement is quite different than the one described at the beginning. Mainly so NO ozone reaching the sensor. Sabine can not know, but she has their chemical supplier, each previously discussed sensor needs a minimum concentration of the disinfectant "to survive". The system requires a security- and no measuring device.
If the sensor is used under these conditions DOSASens OZ, then the sensor has smaller maintenance intervals, and what is even more important, the risk is not covered by the sensor. When Sabine in the Selection table for sensors looks at the top Webseitewie, Then she finds a sensor type for the "absence of chlorine". And, what a happy accident, der Sensor (DOSASens CN) has a 1:1-Queremfpfindlichkeit for ozone, found in the columns to the right next to it. Cross sensitivity in this case means, the sensor also shows concentrations of ozone on.
Of course, the function of the security must be checked regularly. Also it is sufficient, to direct the water from the reactor at 1.0 mg / l on the sensor.
Summary
On these and related topics can be found on my website www.aquaandpools.de some tutorials. Apart from a different style of description deeper information is there, For example, on the operation of sensors, to find. Thank you for the interest! I am glad about every feedback.


Leave a Reply
You must be logged in to post a comment.